When you fly: the patterns hiding in your travel history
Totals tell you how far you have flown. Patterns tell you how you travel. Below the headline numbers on your TripStow stats page sits a set of charts built from every flight you have logged, and most people find something in them they did not know about themselves.
Year by year
Every year you have flown, side by side. Switch between flights, distance and hours in the air, and TripStow picks out your best year for each. The three rarely agree: a year of short work trips can win on flights while a single long-haul holiday wins on distance.
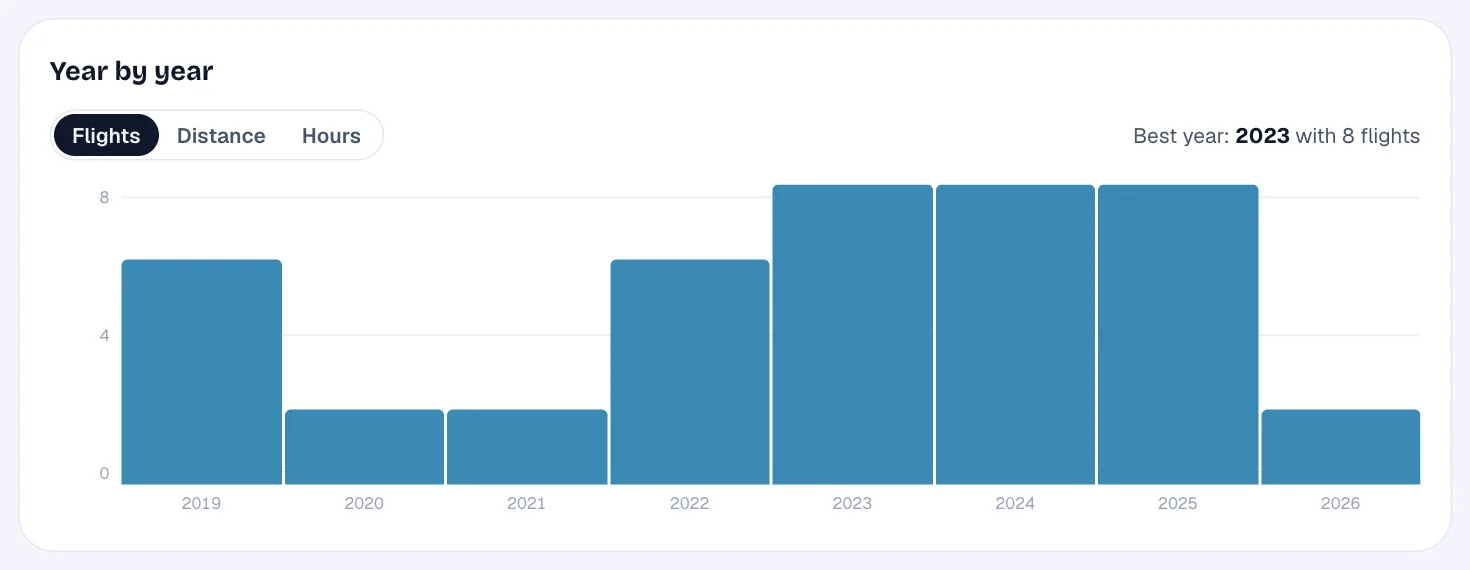
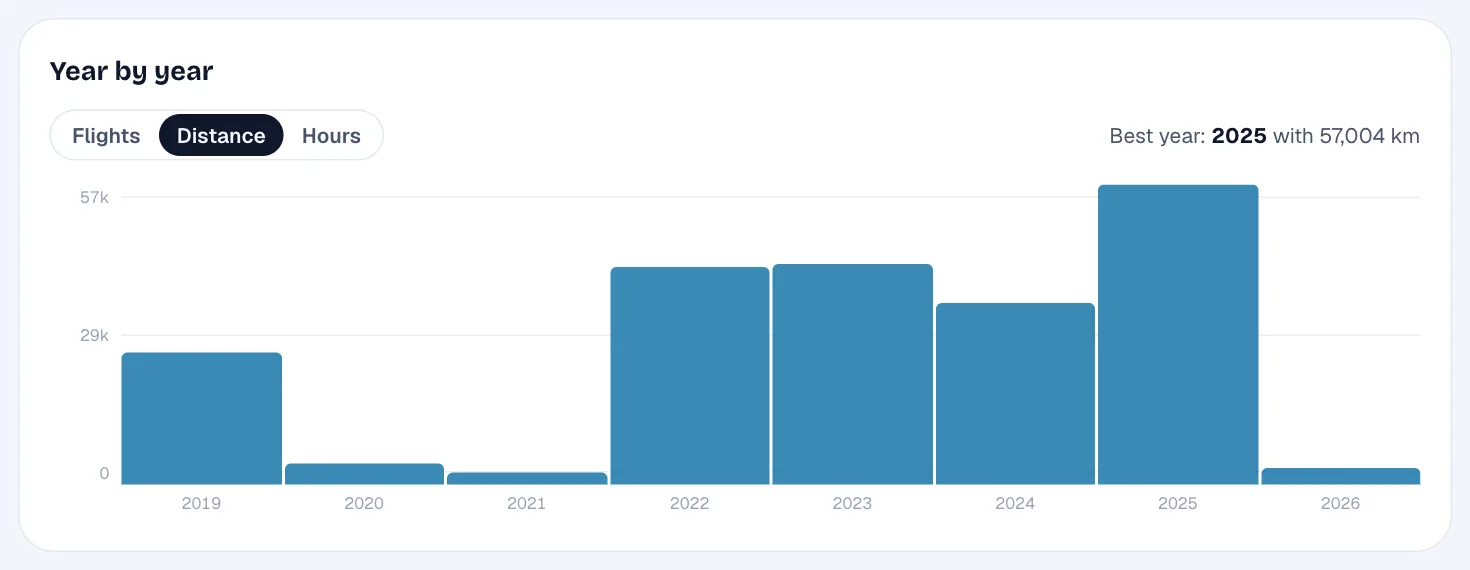
Tap any year on your stats page to see every number for that year alone, then turn it into a share card.
When you fly
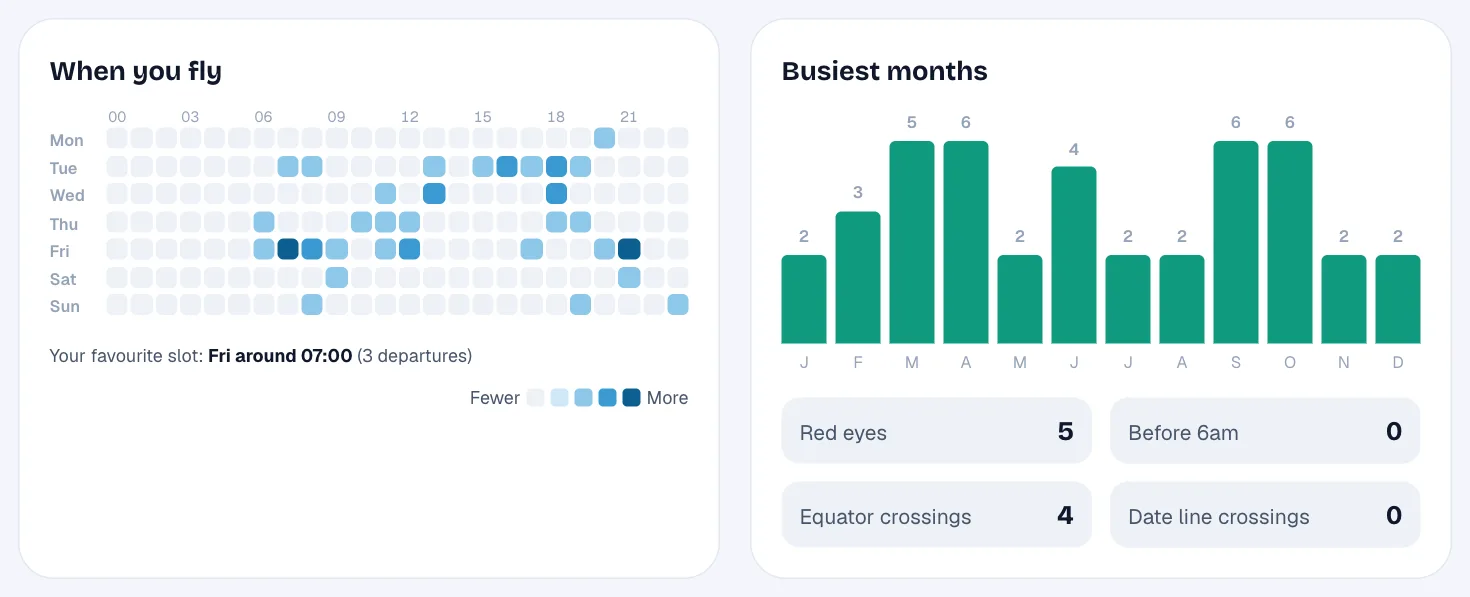
The heatmap plots every departure by day of the week and hour of the day, in the local time where the flight left. Darker squares mean more departures, and TripStow names your favourite slot underneath. Business travellers tend to see a dark stripe on Monday mornings and Thursday evenings. Holiday flyers light up Fridays and Saturdays. Hover or tap any square for the exact count.
Busiest months
All your flights stacked up by calendar month, across every year. It shows at a glance whether you are a spring and autumn traveller, a summer-holiday family, or someone who escapes the winter every January.
The moments along the way
- Red eyes: overnight flights, leaving between 9pm and 2am local time and lasting at least five hours.
- Before 6am: the dawn departures, and the alarm clocks that came with them.
- Equator crossings: every flight that took you between the hemispheres.
- Date line crossings: the flights where you lost, or gained, a whole day.
Each of these also counts towards a badge, from Red Eye Warrior (ten overnight flights) to Date Line Dancer.
Where the data comes from
The charts use the flights already in your TripStow account, whether you forwarded the bookings, imported a flight log from another app, or added them by hand. Times are always the local time at the airport you left from, so a 7am flight from Singapore counts as 7am, wherever home is.
Why it matters
Knowing your patterns is useful as well as fun. It shows whether all those early starts are worth rethinking, which months to watch for fares, and how much of your life happens at 35,000 feet. For the headline numbers and share cards, read Your travels in numbers, ready to share, or import your flights and see your own patterns.